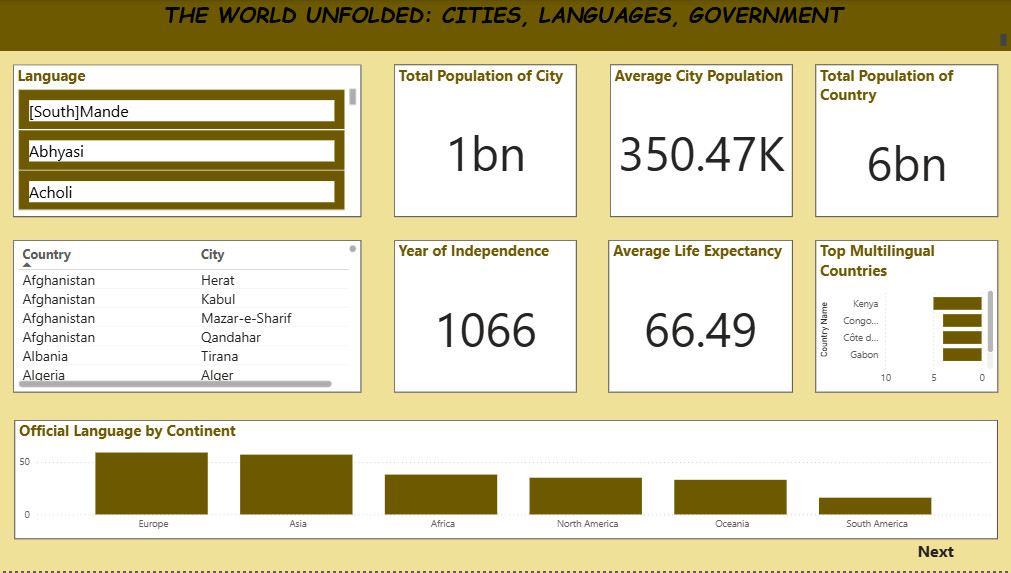

This dashboard is the result of days spent exploring a Kaggle dataset and turning raw numbers into meaningful visuals. It covers everything from city populations and government types to multilingual regions and economic indicators. It's the first dashboard I created using PowerBi
This dashboard is the result of days spent exploring a Kaggle dataset and turning raw numbers into meaningful visuals. It covers everything from city populations and government types to multilingual regions and economic indicators. It's the first dashboard I created using PowerBi